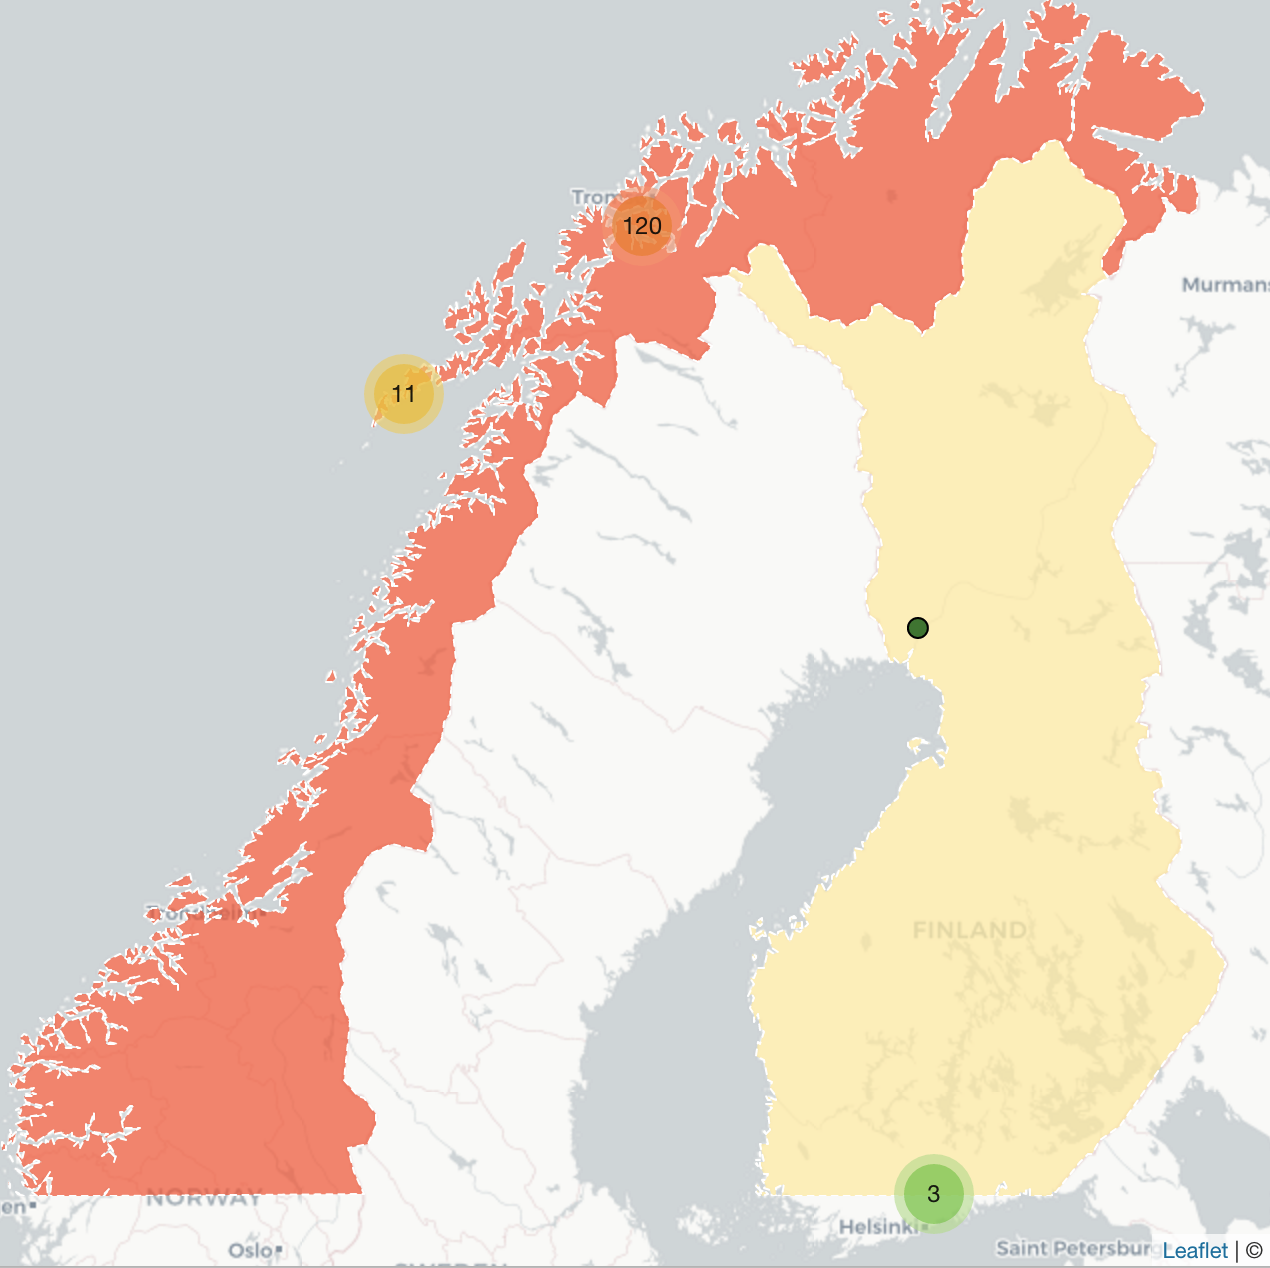
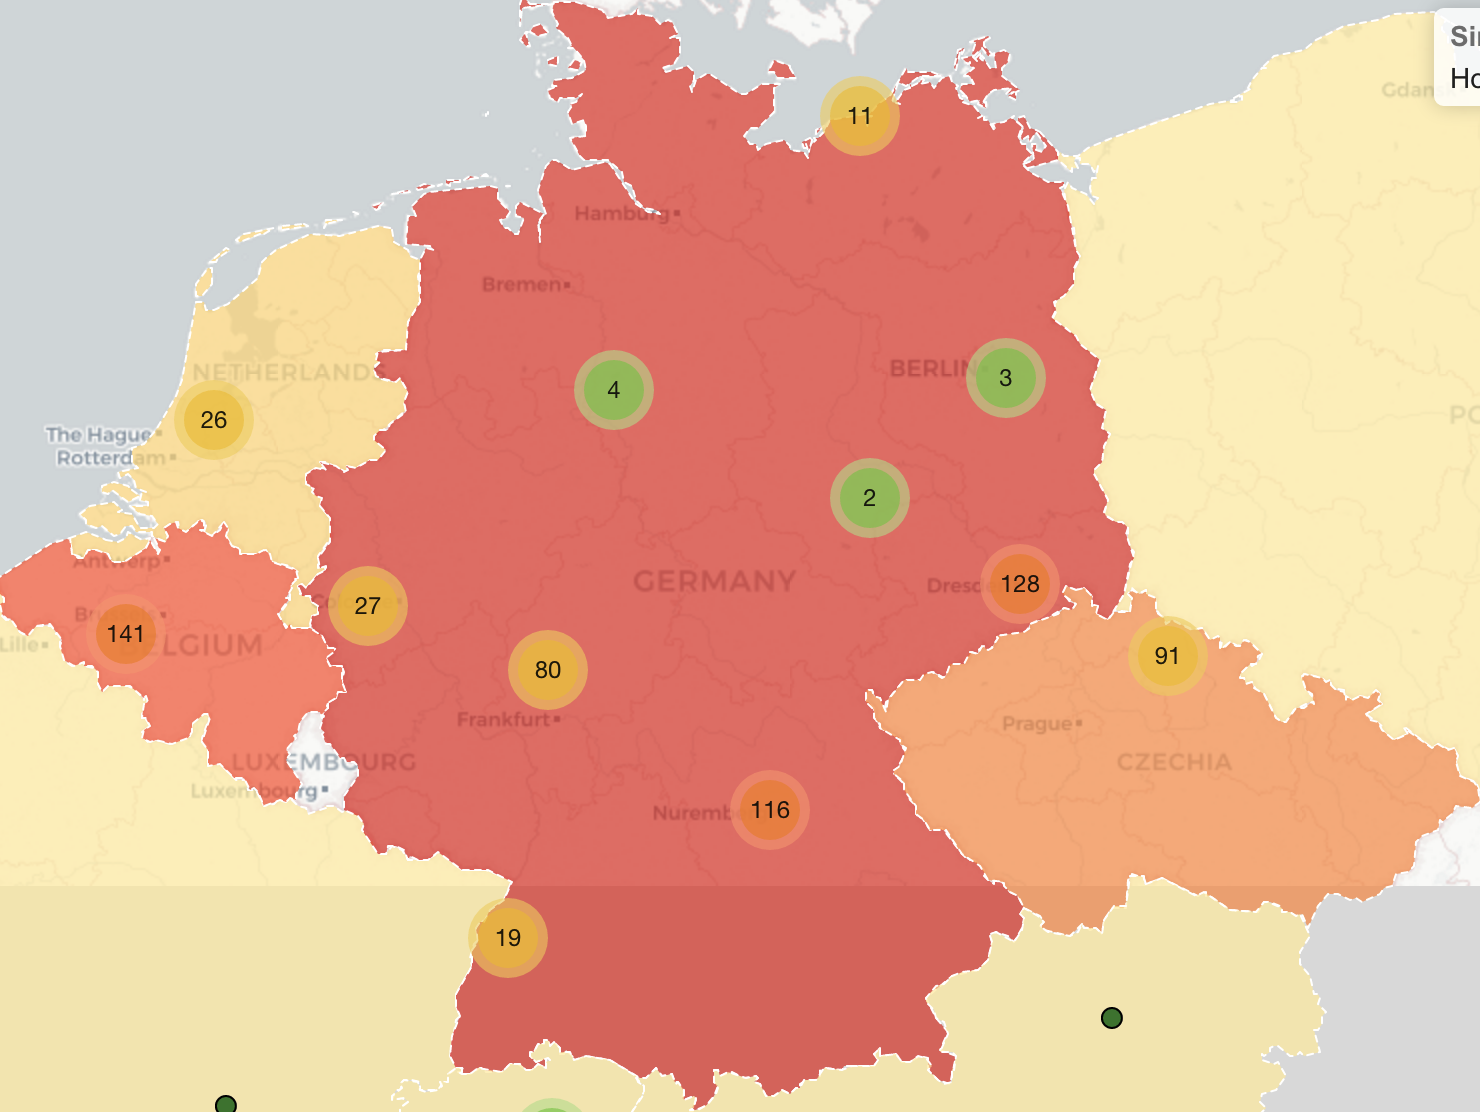
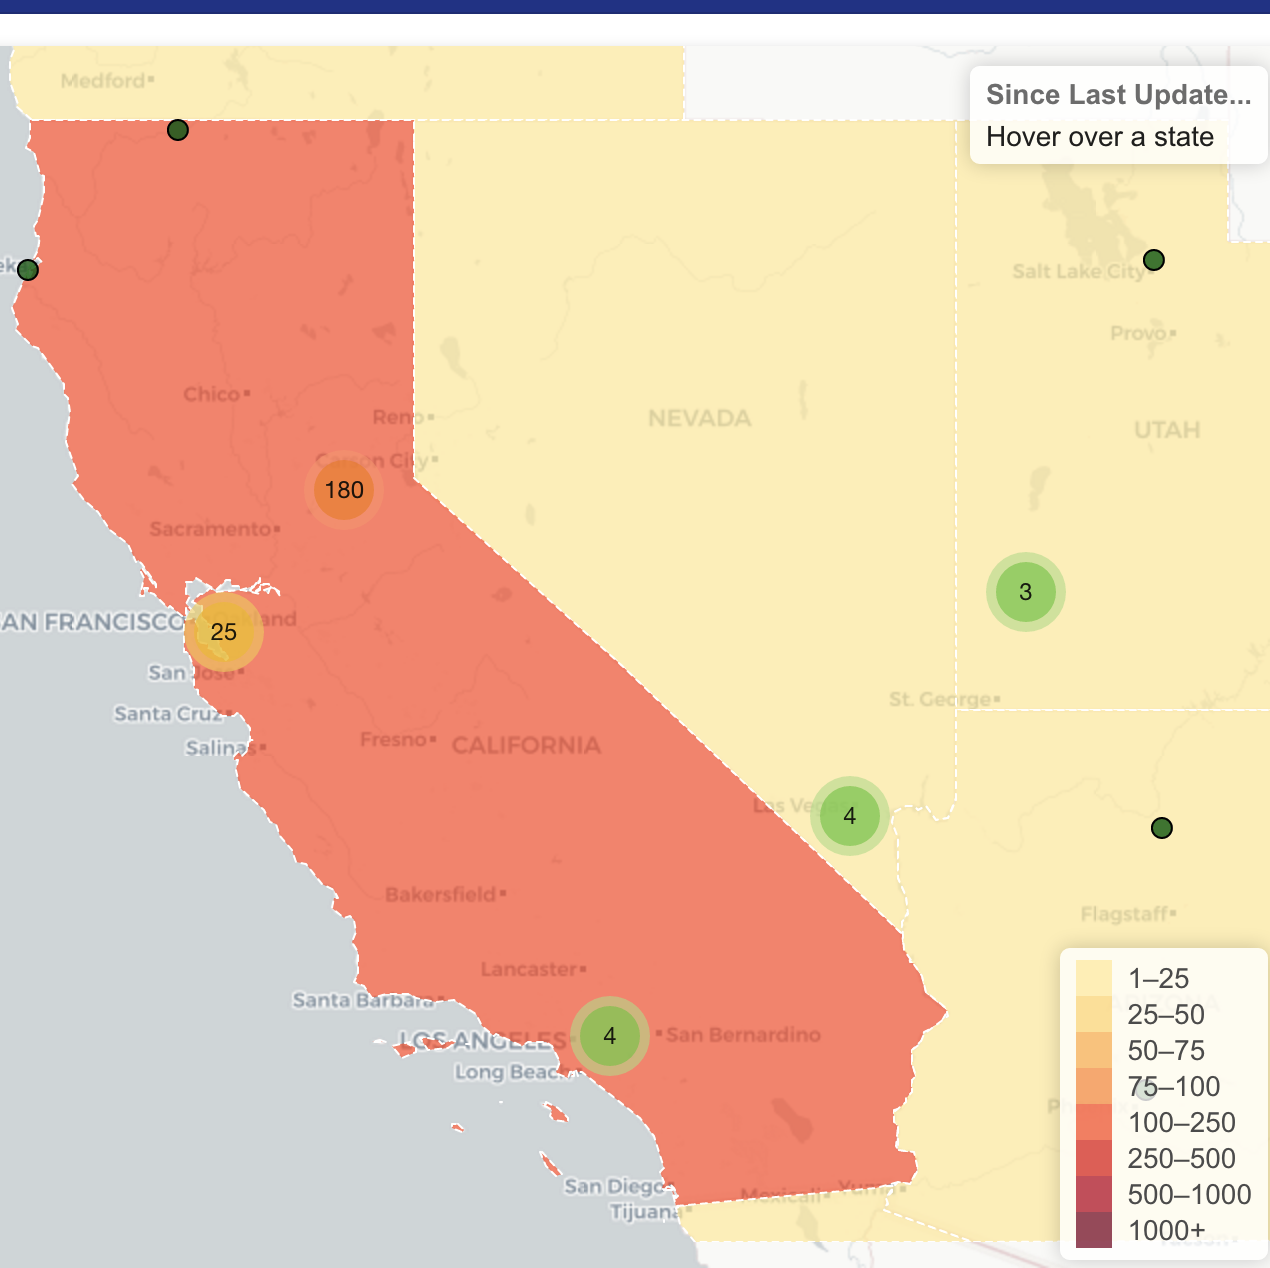
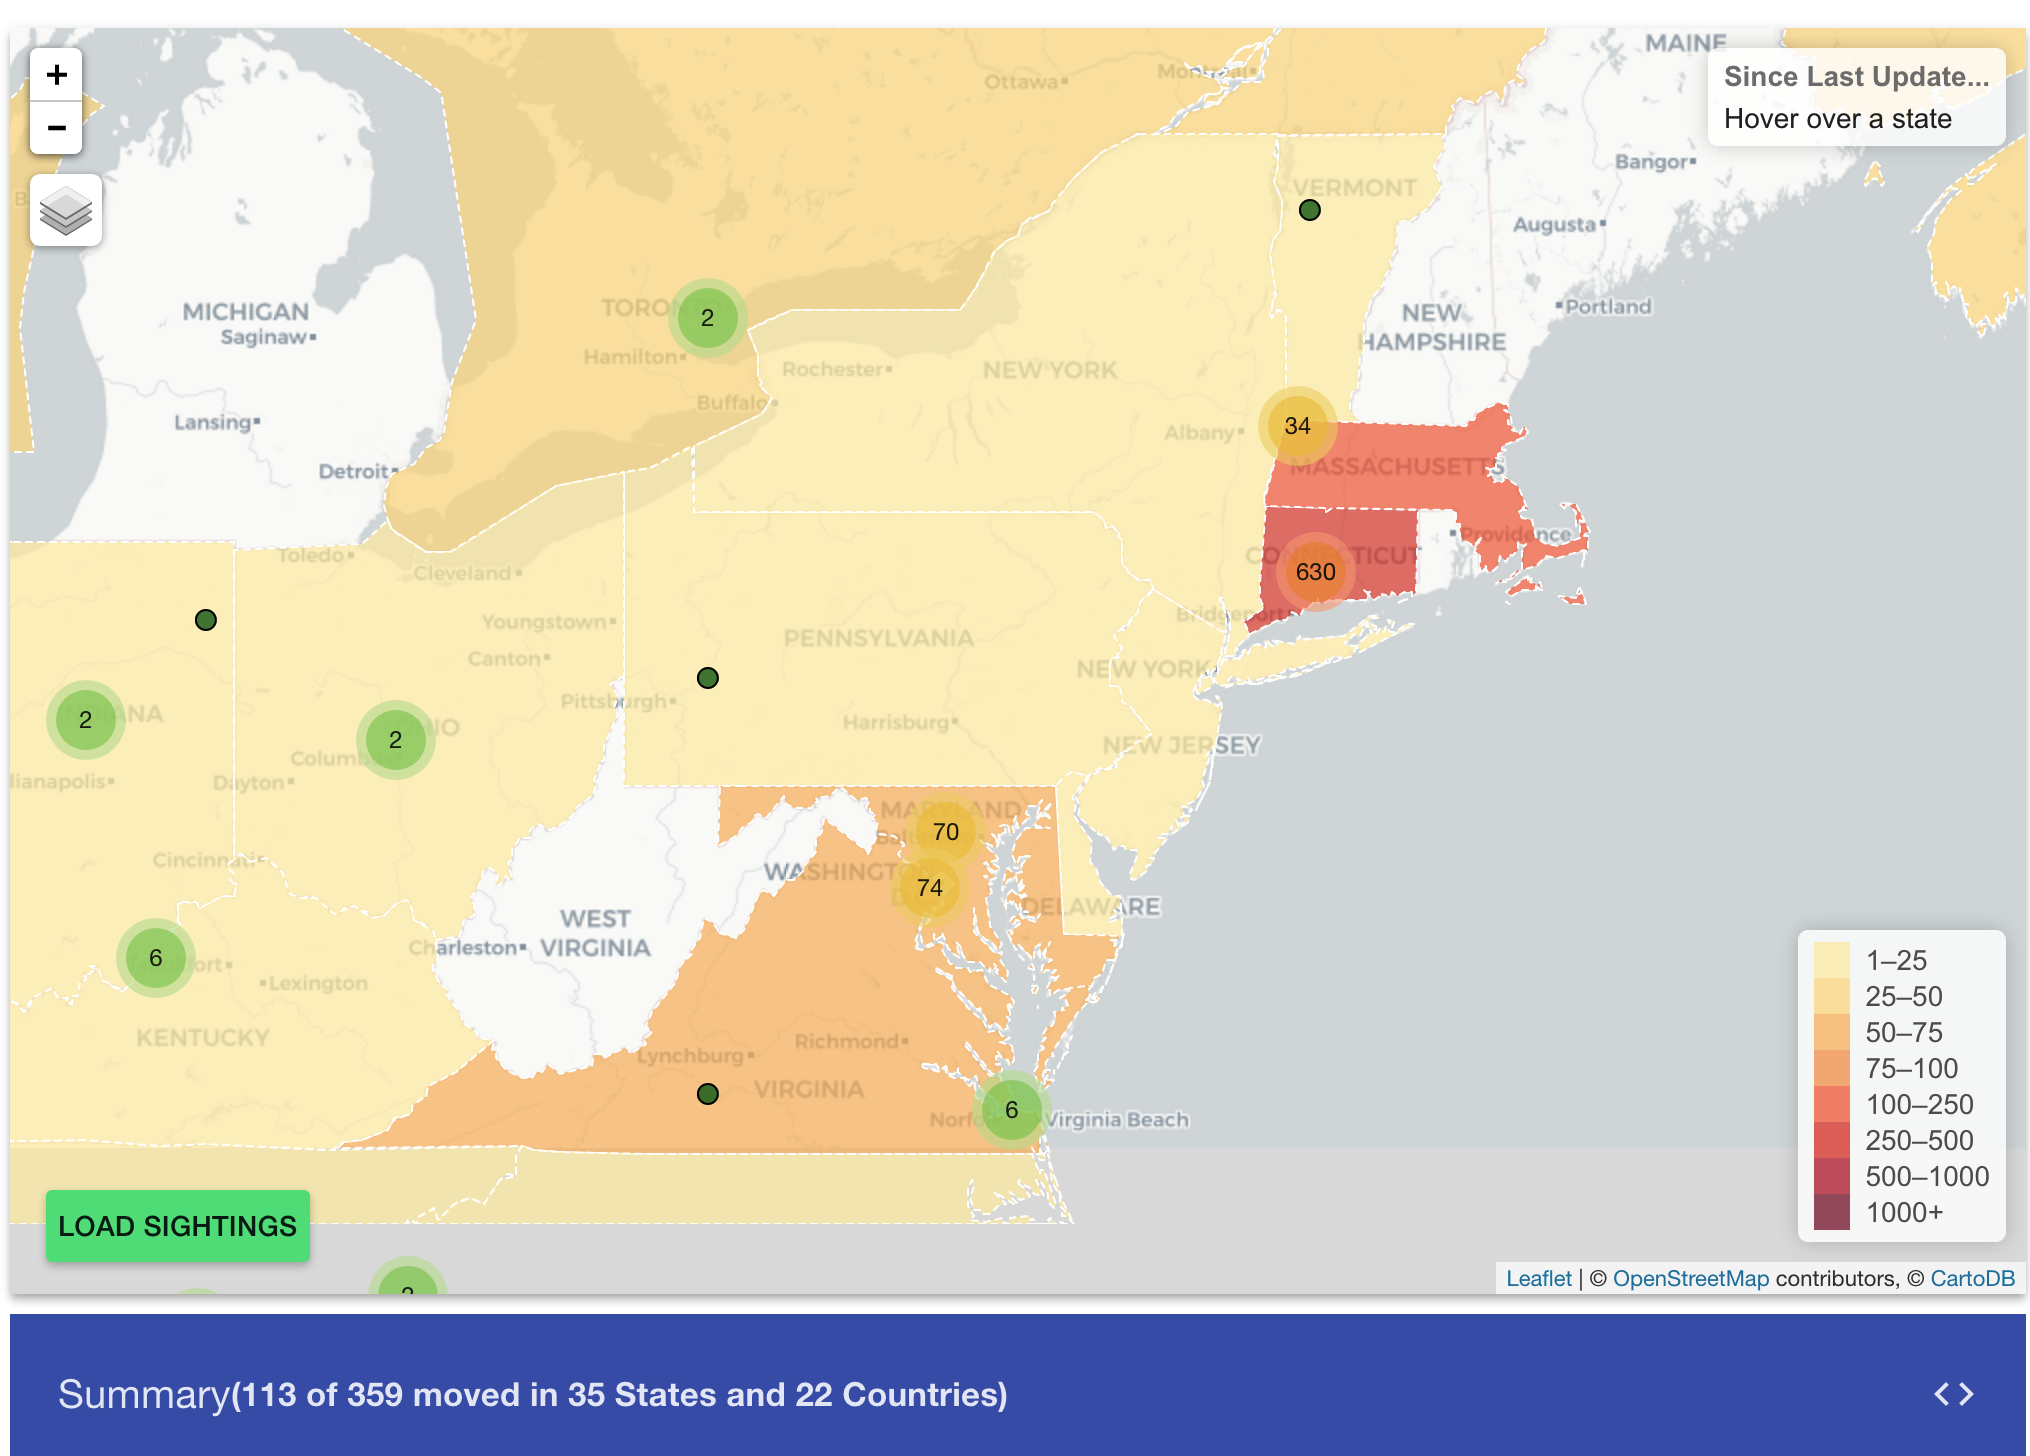
Due to technical issues, the graphics for this update (in this post) only include sightings between 11 DEC 2020 and 13 JAN 2021. Overall, all numbers and graphics on the site include all sitings since our last post and the update in August of 2020. Don’t have a body count for you this time around, it is just too exhausting and depressing. The primary active areas since we ran the gear in December showed the U.S.A. and Germany to be the most active areas, followed by Norway. In the U. S. A. New England and California topped the charts. The graphics below will give you some idea. Wash your hands. Seal your face or seal your fate. With multiple viruses running around, and all of us hosting them, well, you know the drill by now.